
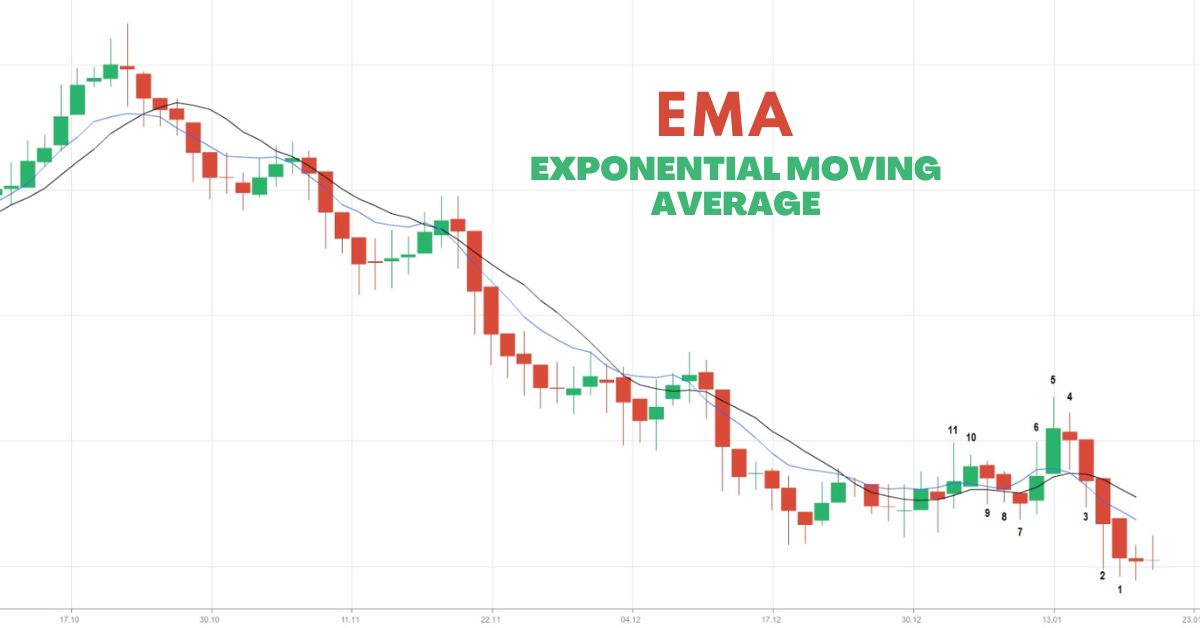
Simple moving averages, as we discussed in the previous lesson, can be skewed by spikes. Let’s begin with an example.
Assume we draw a 5-period SMA on the EUR/USD daily chart.
The closing prices for the last 5 days are as follows:
Day 1: 1.3172
Day 2: 1.3231
Day 3: 1.3164
Day 4: 1.3186
Day 5: 1.3293
The simple moving average would be calculated as follows:

(1.3172 + 1.3231 + 1.3164 + 1.3186 + 1.3293) / 5 = 1.3209
Isn’t it obvious?
What if, on Day 2, there is a news report that causes the euro to fall across the board?
As a result, the EUR/USD falls and closes at 1.3000. Let’s see what impact this has on the 5-period SMA.
Day 1: 1.3172
Day 2: 1.3000
Day 3: 1.3164
Day 4: 1.3186
Day 5: 1.3293
The simple moving average would be calculated as follows:
(1.3172 + 1.3000 + 1.3164 + 1.3186 + 1.3293) / 5 = 1.3163
The result of the simple moving average would be much lower, giving the impression that the price was genuinely falling when, in reality, Day 2 was just a one-time occurrence triggered by dismal economic report results.
The point we’re attempting to make is that the basic moving average can be overly simplistic at times.
If only there was a method to filter out these spikes so you didn’t get the wrong impression.
It is known as the Exponential Moving Average!
The most recent periods are given more weight by exponential moving averages (EMA). In our previous example, the EMA would place more emphasis on the most recent days’ pricing, which would be Days 3, 4, and 5.
This means that the Day 2 spike will be of lower value and will have less of an impact on the moving average than if we calculated for a simple moving average.
When you think about it, this makes a lot of sense because it emphasizes what traders have been doing recently.
Exponential Moving Average (EMA) vs. Simple Moving Average (SMA)
Let’s look at the USD/JPY 4-hour chart to see how a simple moving average (SMA) and exponential moving average (EMA) might look side by side on a chart.
Take note of how the red line (the 30 EMA) appears to be closer in price than the blue line (the 30 SMA). This implies it more precisely reflects recent price movement. You’ve probably guessed why this occurs.
It’s because the exponential moving average emphasizes what has recently occurred. It is considerably more crucial to look at what traders are doing NOW rather than what they were doing last week or last month while trading.

Next Lesson: Simple vs. Exponential Moving Averages